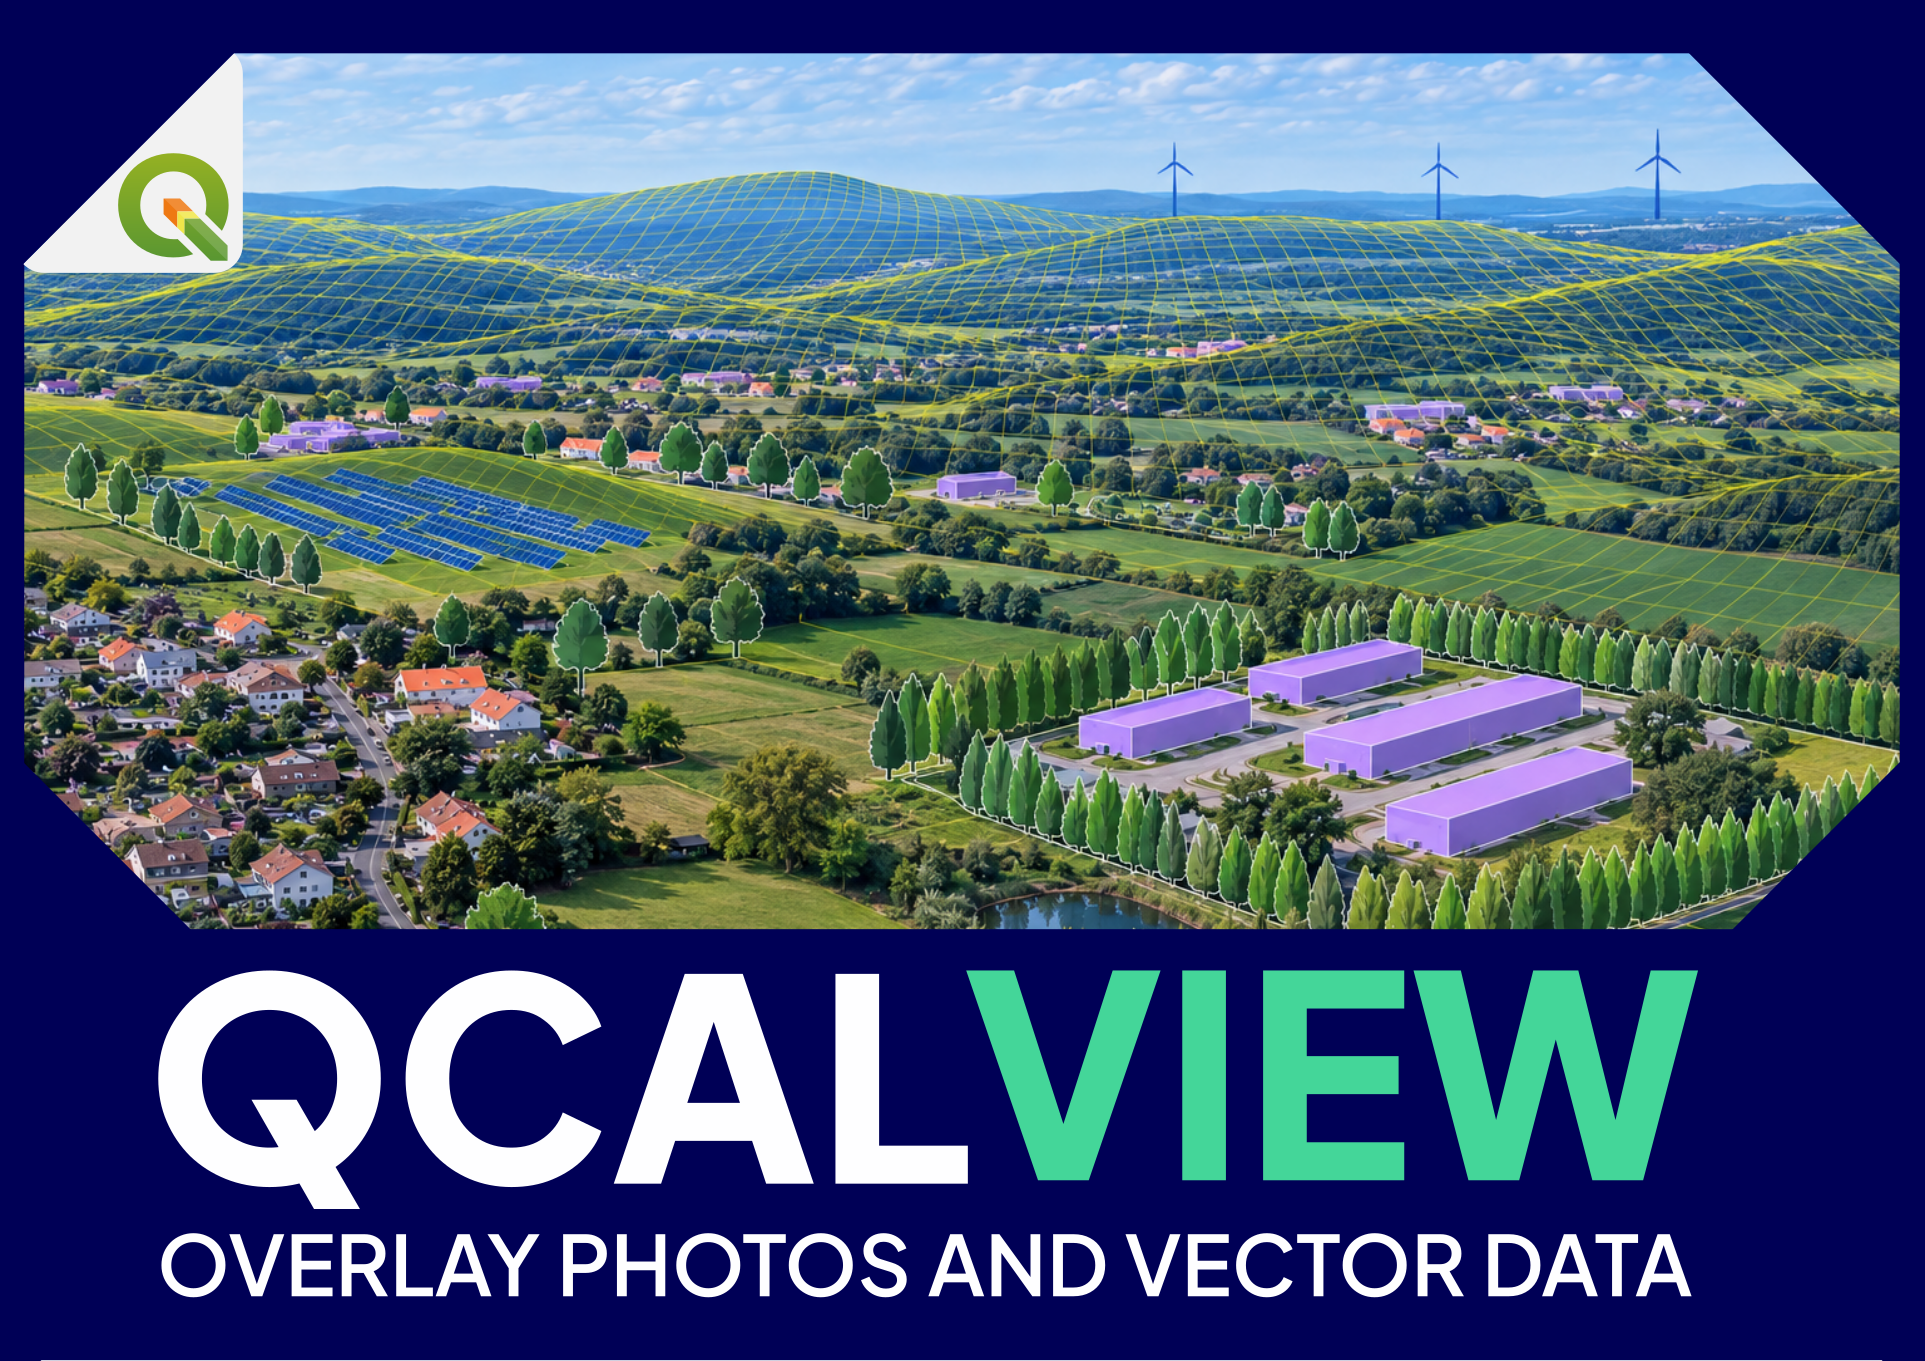
Visualize, simulate and communicate
Once a viewpoint is calibrated, QCALVIEW becomes a bridge between the QGIS map and the visual field of an observer.
This is the second major level of the plugin: projecting geographic information into a calibrated photographic or schematic view so that layouts, variants and landscape measures can be compared in perspective.
The basic idea#
A QGIS layer normally answers:
Where is the object on the map?
A calibrated QCALVIEW view adds:
Where should that object appear from this observer position, with this camera geometry?
This allows map data and visual evidence to be discussed in the same frame.
What can be projected#
Depending on the representation, QCALVIEW can work with:
- point layers;
- line layers;
- polygon layers;
- raster layers draped on terrain;
- 2.5D extrusions;
- schematic motifs and repeated symbols;
- project states controlled by QGIS themes.
QGIS style and QCALVIEW representation are related but not identical#
QGIS provides the source layer, attributes and cartographic style. QCALVIEW must then translate that information into a perspective view.
Some representations are direct:
- line colour;
- fill colour;
- opacity;
- label information.
Others need QCALVIEW-specific geometric meaning:
- height/extrusion;
- billboard or motif dimensions;
- repeated trees/hedges;
- screen height;
- special schematic representation.
When a layer looks different from the map canvas, distinguish two questions:
- Is the QGIS style being interpreted correctly?
- Is the QCALVIEW spatial representation configured correctly?
Points#
Point layers can represent:
- turbine positions;
- poles;
- project markers;
- survey/control points;
- symbolic objects.
A point may be rendered with a 2D/schematic motif whose real-world width/height can be meaningful.
Lines#
Line layers are useful for:
- roads;
- fences;
- hedges;
- linear screens;
- cables;
- project boundaries;
- alignments.
A line can also become an extruded vertical strip or repeated motif line.
Polygons#
Polygons can represent:
- building footprints;
- solar/agrivoltaic areas;
- vegetation blocks;
- project zones;
- screening areas.
With extrusion they can become simple 2.5D volumes.
QCALVIEW is not a full solid-modelling engine, but these simple volumes are often enough to test visibility and visual masking hypotheses.
2.5D extrusion#
2.5D extrusion gives a vector feature vertical extent without requiring a full 3D model.
Typical uses:
- a building footprint extruded to 8 m;
- a hedge line extruded to 4 m;
- a wall or acoustic screen;
- a project element with a known top height.
Schematic motifs#
Motifs allow QCALVIEW to represent classes of objects visually without loading a full 3D asset.
Examples include:
- deciduous trees;
- conifers;
- hedges;
- fences;
- vehicles;
- agricultural machinery;
- animals.
They are useful for:
- quick landscape-mitigation tests;
- illustrating vegetation structure;
- producing understandable schematic views;
- comparing states without photorealistic rendering.
Treat them as controlled visual symbols, not photorealistic evidence.
Terrain occlusion#
Terrain can hide projected geometry.
When terrain occlusion is active, QCALVIEW uses the DEM to decide whether geometry is behind relief from the current viewpoint.
This is fundamental for:
- distant wind-project views;
- valley/ridge studies;
- screening by topography;
Terrain occlusion does not automatically include trees or buildings unless those are represented separately by suitable vector/schematic geometry.
Skyline and ridgelines#
Skyline/ridgeline display serves two purposes:
- calibration support;
- interpretation of why an object is or is not visible.
A projected turbine whose hub is just behind a ridge has a different visual meaning from a turbine fully exposed above the skyline.
Raster draping#
A raster can be draped over the terrain and projected into the view.
Possible uses:
- ZVI/visibility result for explanatory purposes;
- land cover;
- suitability or constraint rasters;
- other spatial results that benefit from being related to the observer's view.
This is not the same as a QGIS 3D view: QCALVIEW keeps the calibrated observer/camera relationship as the primary reference.
QGIS map themes#
Map themes are a powerful way to define project states.
For example:
- existing state;
- layout A;
- layout B;
- layout C;
- project without mitigation;
- project with 3-year hedge;
- project with 10-year hedge.
Good practice#
Give themes explicit names that remain understandable later. Avoid Theme 1, Theme 2 for professional work.
Comparing project variants#
A calibrated viewpoint makes variant comparison much stronger because the camera geometry remains fixed while the project state changes.
Typical comparisons:
- turbine layout A / B;
- 180 m / 200 m / 220 m tip height;
- alternative colour/style;
- solar layout before/after design change;
- hedge absent / present / mature;
- building or screen heights;
- different project phases.
The aim is to change one study hypothesis at a time while keeping the viewpoint and camera controlled.
Schematic view#
A schematic view uses the QCALVIEW camera and terrain logic without a photographic background.
This is valuable when:
- there is no photograph;
- the camera needs to move away from the original photo position/height;
- a study requires many synthetic viewpoints;
- you want to explain geometry rather than photographic appearance;
A schematic view is not a degraded photograph. It is a different representation whose strength is geometric clarity.
Working in meetings#
QCALVIEW can be useful as a coordination tool because participants can discuss:
- the same geographic point;
- the same calibrated view;
- the same project layers;
- the same variant/theme;
- a clearly identified observer position.
This can reduce ambiguity when someone says “the project is visible from here” or “the hedge should hide that turbine”. The statement can be related to explicit geometry.
Testing landscape mitigation#
For a hedge, wall or building screen, QCALVIEW can be used at two levels.
Visual level#
Represent the proposed screen and inspect it in the calibrated view.
Export types#
Depending on the workflow, QCALVIEW can produce:
- composite view;
- overlay/transparent result;
- schematic view;
Use transparent overlays when another document or image-compositing workflow should control the final background.
What makes a visual comparison defensible#
Keep these variables controlled:
- viewpoint position;
- projection;
- HFOV/VFOV;
- output size;
- camera orientation;
- layer/theme state;
- object dimensions;
- terrain source;
- any explicit assumptions about screen/vegetation height.
Change only the parameters that the scenario is meant to test.