OPEN-SOURCE QGIS PLUGIN · ALPHA · AVAILABLE FOR TESTING

Put geographic data into perspective.

Give your vector maps another dimension in QGIS.

QCALVIEW makes perspective another way to read geographic data. Start with a schematic view, then calibrate the viewpoint against a photograph when you need to compare mapped information with a real view. Stay in QGIS until the task genuinely requires something else.

Available from the official QGIS Plugin RepositoryExperimental / AlphaExperienced QGIS users welcomeQGIS 3.44 + QGIS 4.xDocumentation ↗
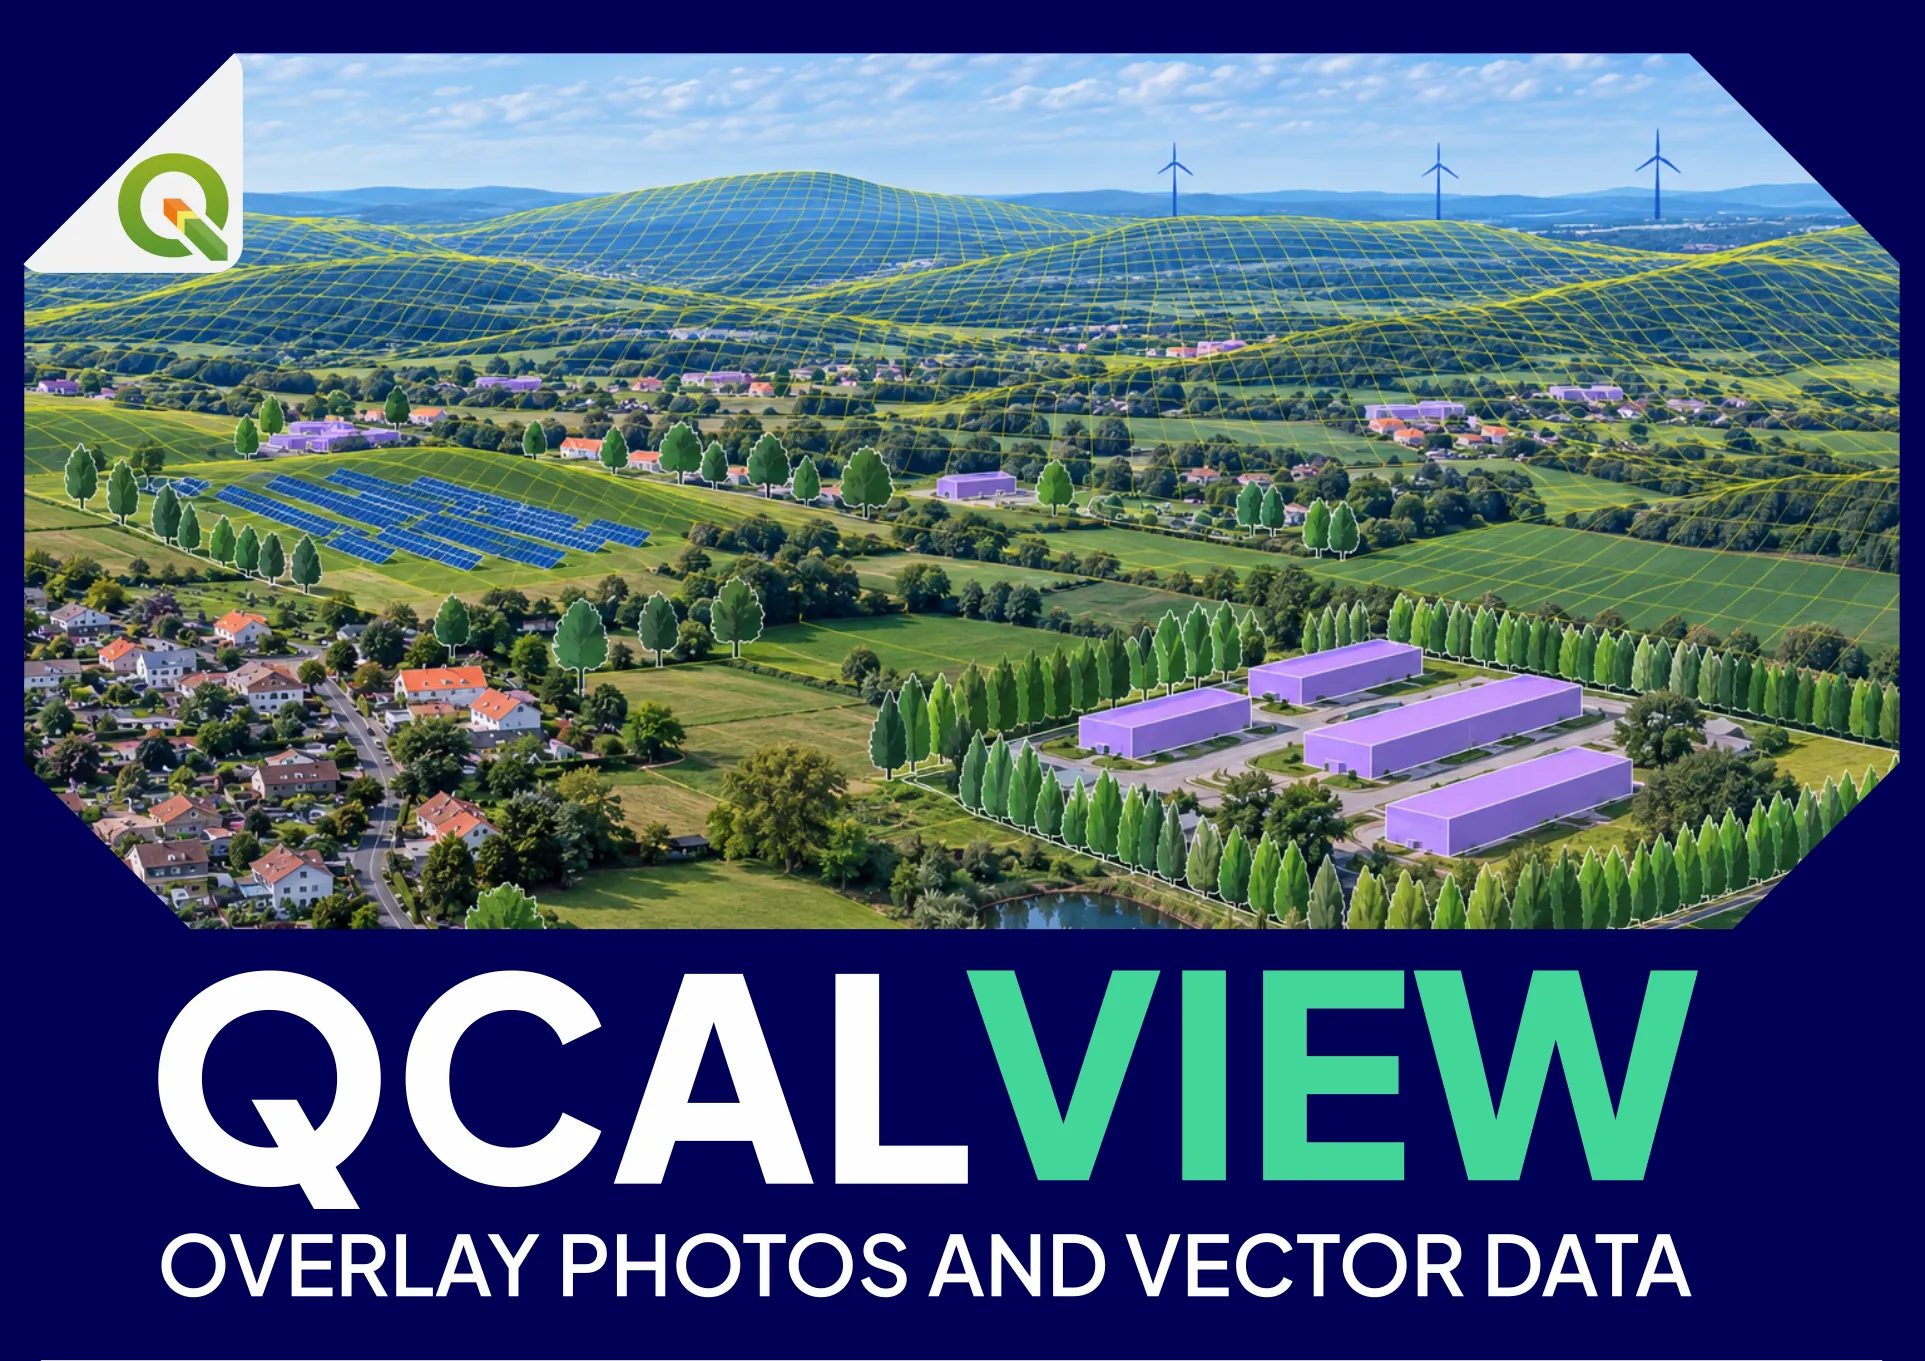
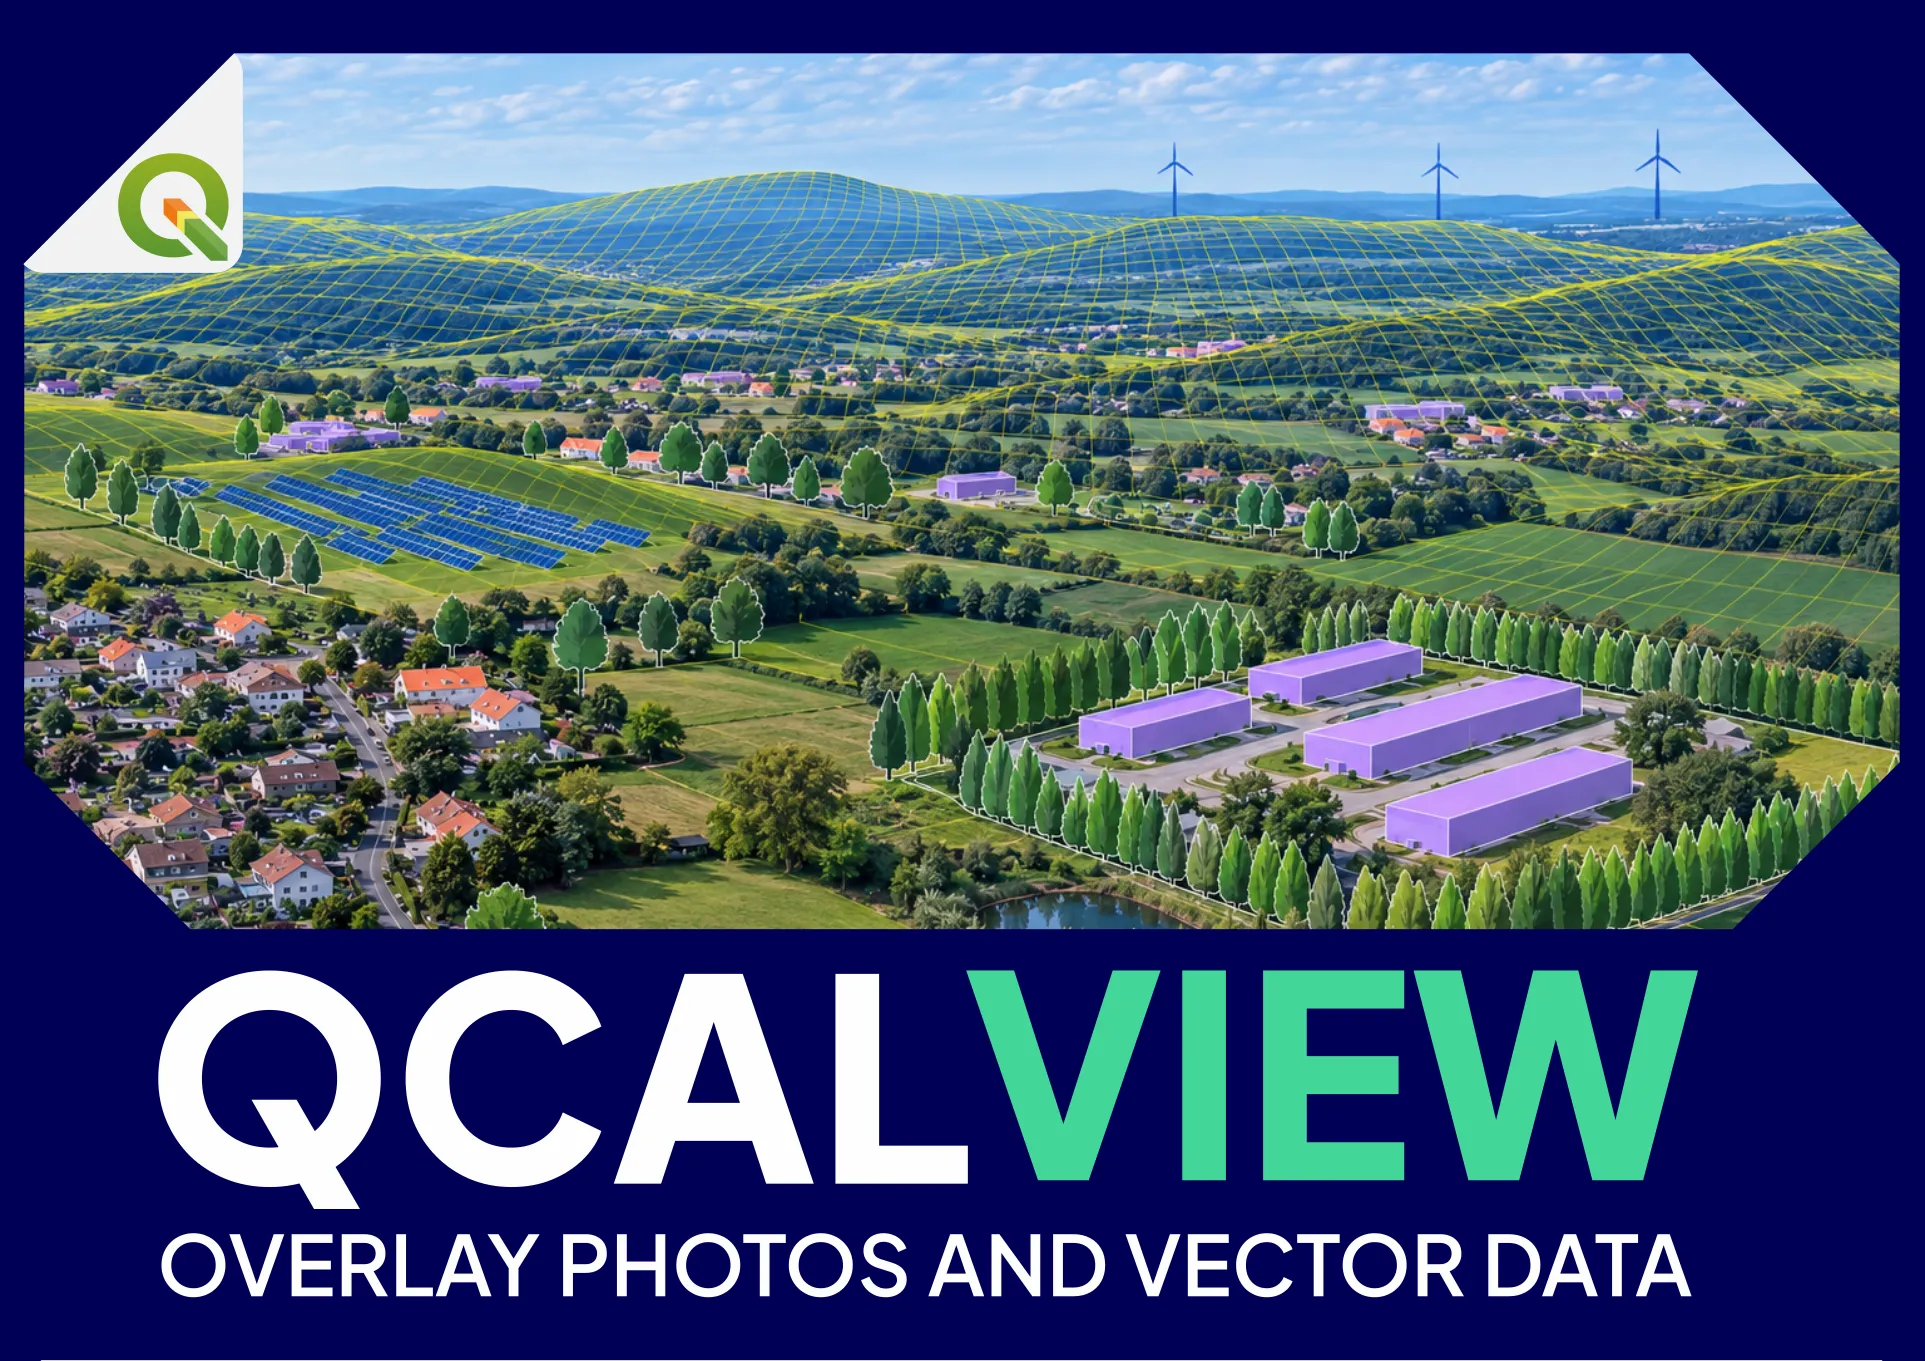
QCALVIEW — overlay photos and vector data in QGIS, including terrain, wind, solar, buildings and vegetation
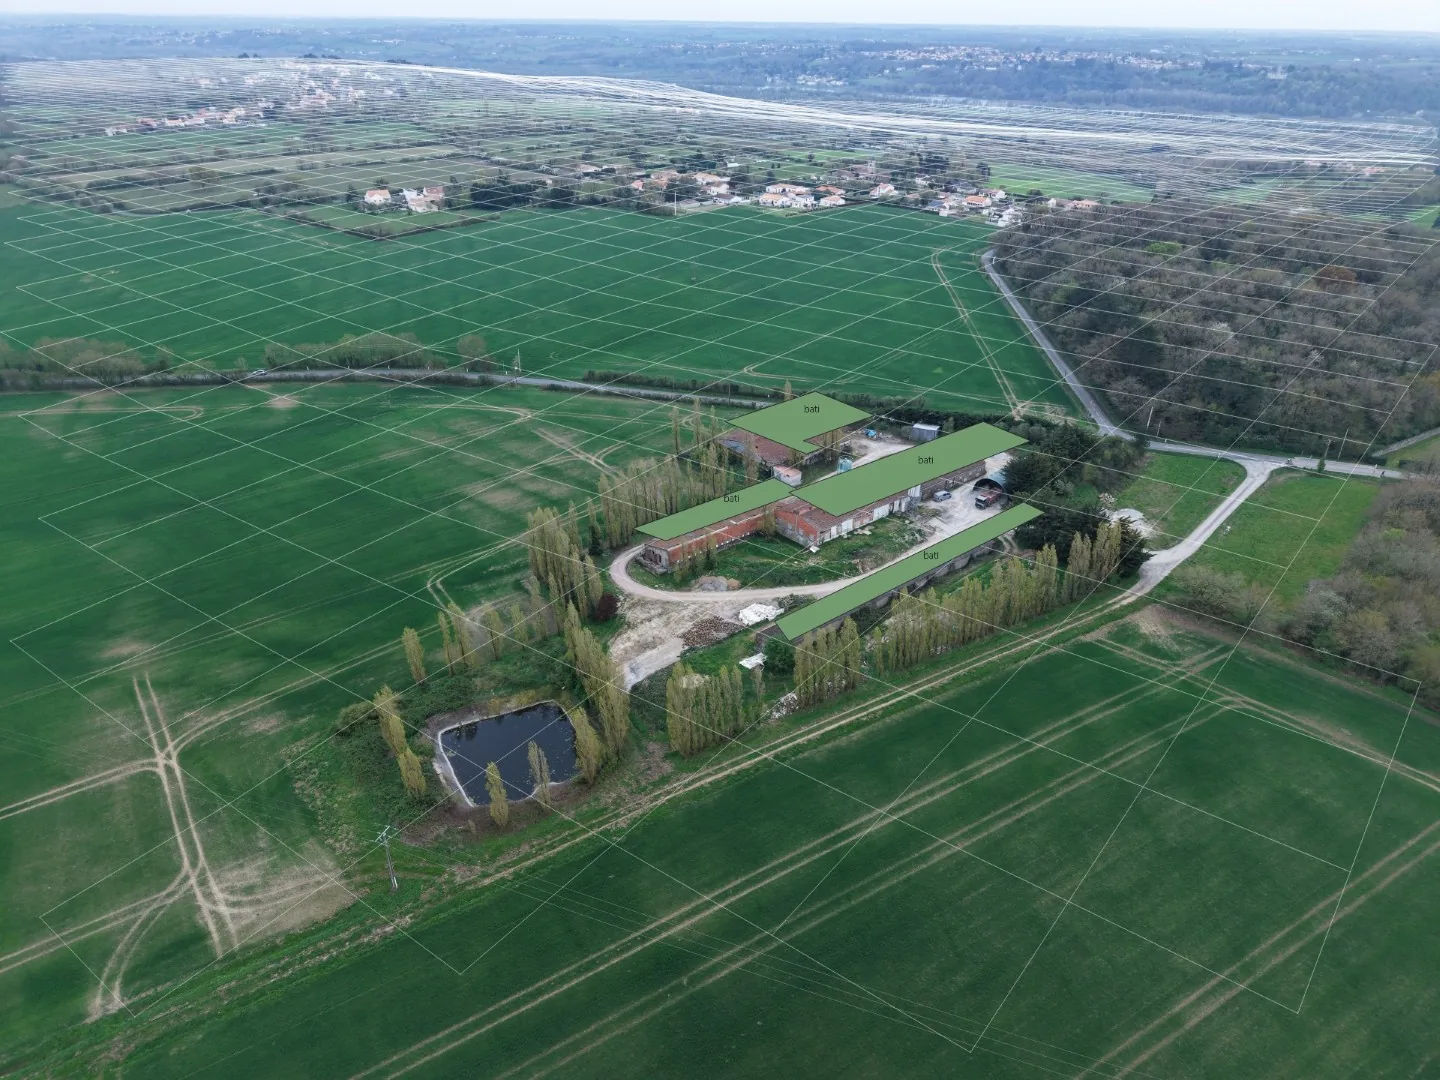
QCALVIEW geographic data projected into perspective
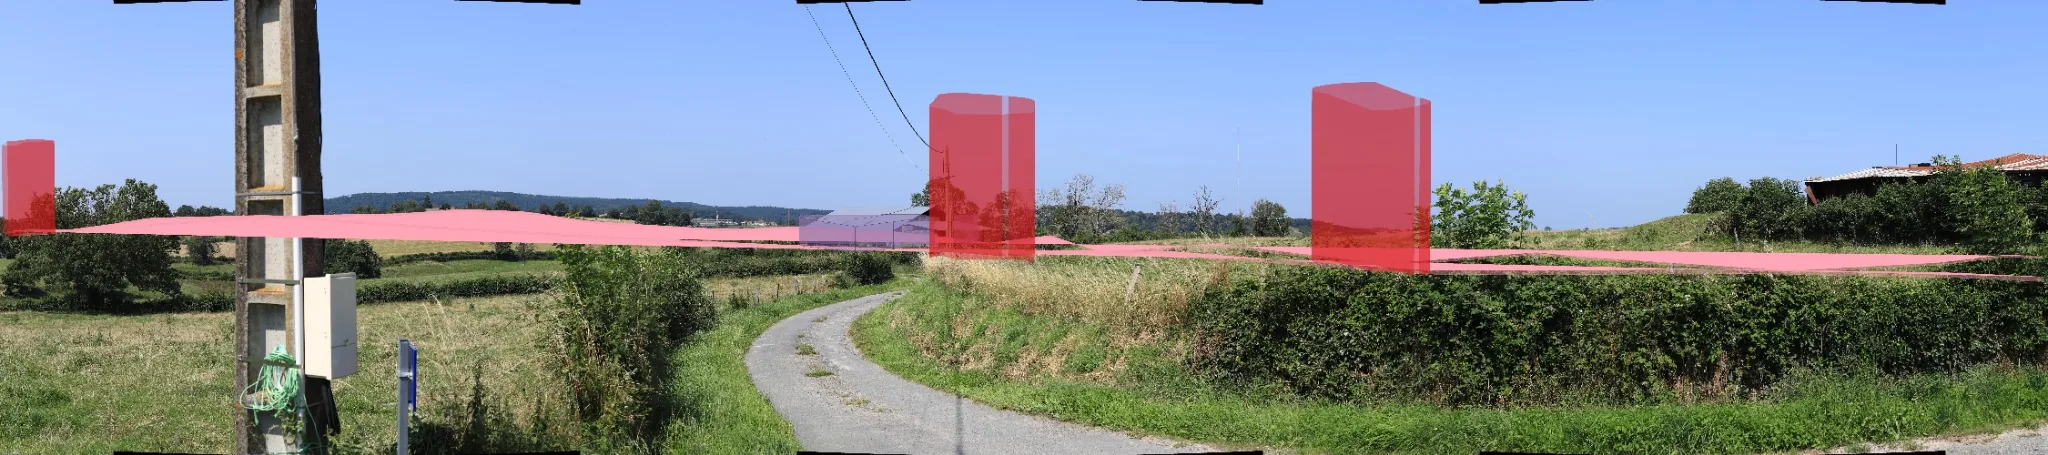
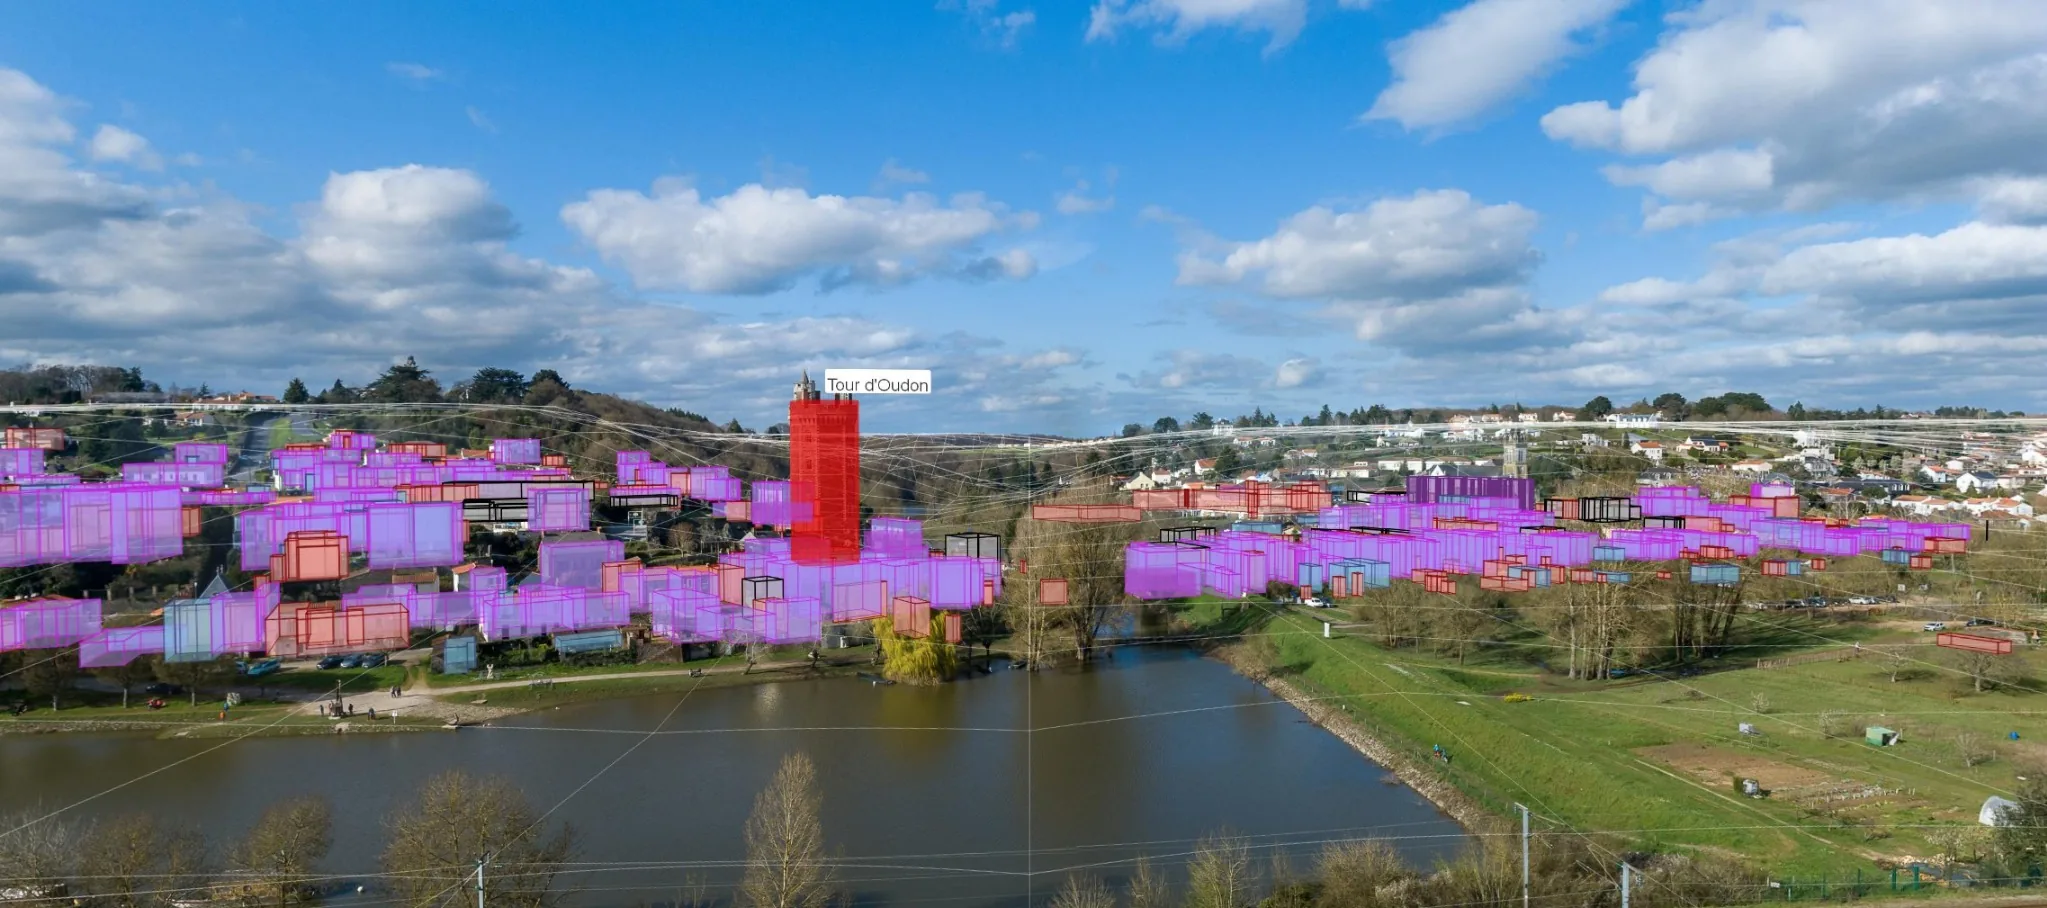
QCALVIEW perspective with mapped project elements projected over a panorama
VIEW perspective | scale | visibility

THE IDEA

“The map is not the territory.”

Alfred Korzybski - Science and Sanity (1933) Null-A echo - “The word is not the thing itself.” - A. E. van Vogt, The World of Null-A

Maps abstract, organise and measure geographic information. Photography records a situated view. You can attach photographs to points on a map, but the relationship usually stops there: the mapped data itself is not projected into the image. QCALVIEW adds the missing spatial link between mapped information, an observer and what can be seen from that position.

Map

Geographic data already organised in QGIS.

Viewpoint

Observer position, orientation and projection.

Perspective

Terrain and mapped data read in the observer's field of view.

Photo

Calibrated visual background when correspondence with a real view matters.

From approximation to precision.

Not every visual question deserves a full modelling pipeline. But a quick answer should not trap you in “close enough” either. QCALVIEW is designed so the same workflow can move from an indicative sketch to a carefully calibrated perspective as the level of evidence increases.

Explore Understand the spatial question with a quick schematic or indicative view.
Align Anchor the observer, orientation, field of view and photography when used.
Control Bring terrain, geometry, distance, scale and occlusion into the visual reading.
Escalate when needed Save the calibration settings to the attribute table or a CSV file, then move to specialist modelling only when the next question genuinely requires it.
Keep geographic data where it belongs. QCALVIEW brings perspective into QGIS itself.

QGIS already manages coordinate systems, transformations and heterogeneous spatial layers, often on the fly. For many visual questions, exporting the project to another application means rebuilding capabilities that are already present in the GIS. QCALVIEW keeps the visual step connected to that source data for as long as it makes sense.

COMMON PIPELINE

GIS → export → rebuild / convert → specialist software → specialist operator → visual answer

QCALVIEW APPROACH

GIS → viewpoint → required level of control → visual answer → specialist software only if the next question requires it

CURRENT CAPABILITIES

Perspective with explicit spatial controls.

ORIENT & CALIBRATE

Establish the view.

  • Viewpoint & photo calibration Position, azimuth, pitch, roll, field of view and camera parameters.
  • Projection models Pinhole / rectilinear, cylindrical and equirectangular workflows.
  • Viewer Inspect the result interactively while keeping the observer parameters explicit.

PROJECT & INTERPRET

Read geographic data from the observer.

  • Projected GIS layers Bring selected vector information into the perspective view.
  • Terrain, horizon & occlusion Use elevation, relief and masks to constrain visibility.
  • Schematic representations Use extrusions, patterns and stylised objects with or without a source photo.

WORK & DECIDE

Keep the visual question active.

  • Interactive monoplotting Navigate between map and perspective coordinates for interpretation and control.
  • Live working sessions Edit mapped hypotheses and read their visual consequence during reviews and meetings.
  • Export Produce views and overlays for sketches, checks, communication or downstream production.
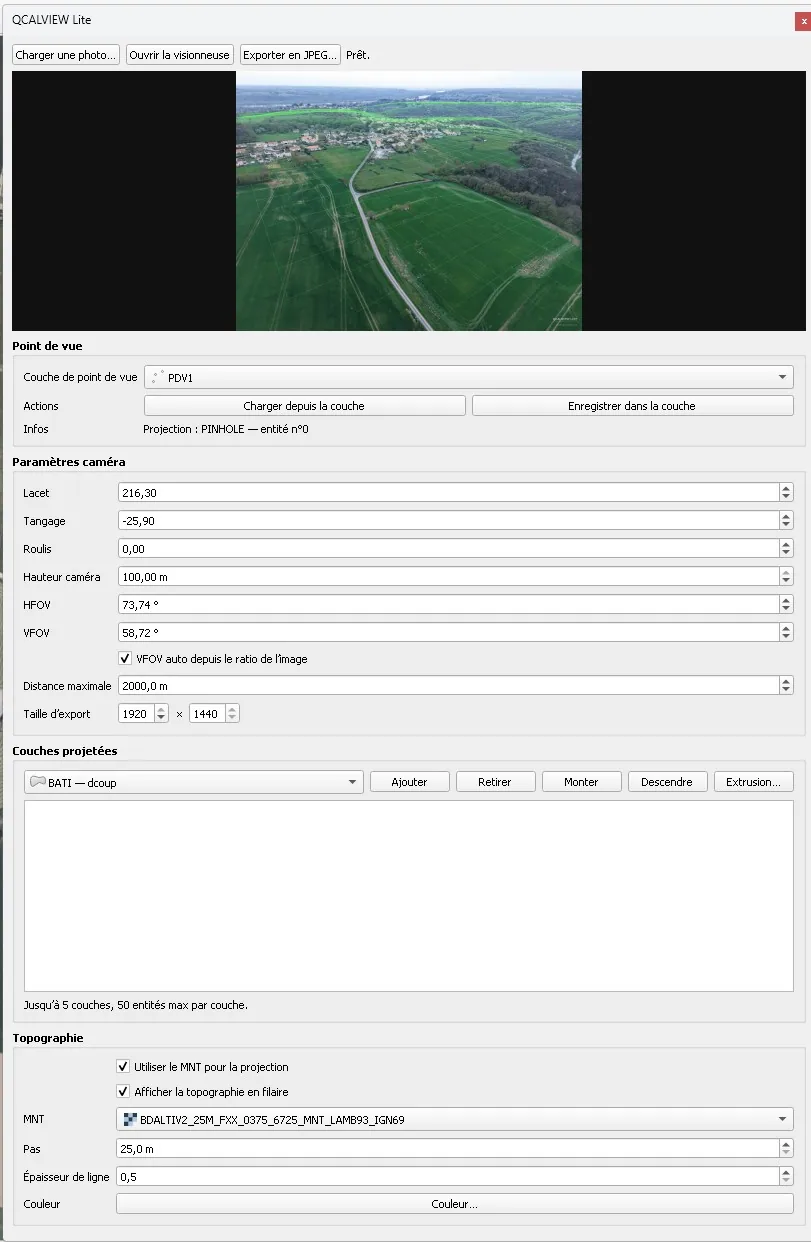
QCALVIEW interface inside QGIS
QGIS + QCALVIEW viewpoint and projection controls
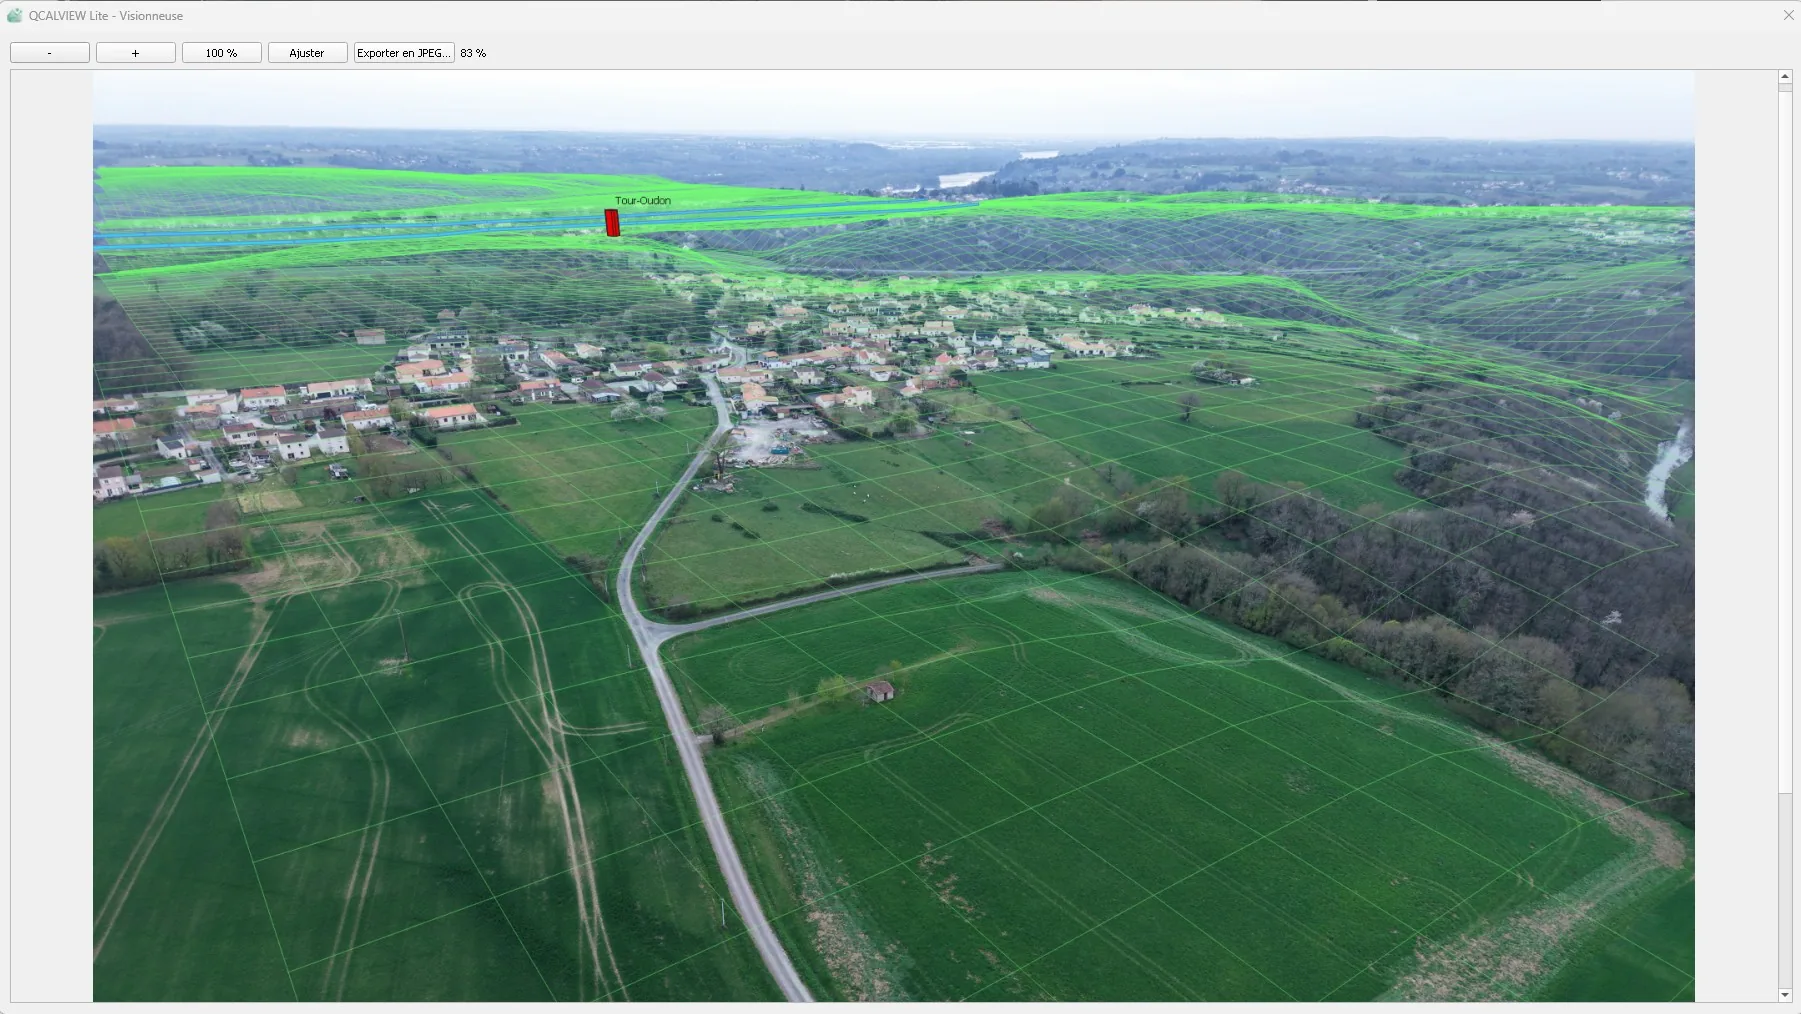
QCALVIEW viewer with geographic overlays projected over an aerial photo
VIEWER projected data in context

FROM OUTPUT TO CONVERSATION

Work on the map while everyone can check the moves.

A visualisation does not have to be a frozen deliverable prepared before the meeting. Share the QGIS session, work directly on the geographic data, and use QCALVIEW to keep the observer-based view in the discussion.

Share QGIS Keep project data, constraints and alternatives visible.
Edit the hypothesis Move, reshape or switch a mapped variant.
See the results Bring the change immediately back into perspective.
Compare and decide Discuss while the alternatives are still editable.

A DIFFERENT ROLE FOR VISUALISATION

Do not only show the answer. Use the view to work on the question.

For planning workshops, project reviews, landscape discussions, archaeological hypotheses, infrastructure coordination or public consultation, the people in the room can see how a geographic choice changes the view without leaving the GIS or waiting for a specialist to rebuild the scene elsewhere.

QCALVIEW turns perspective into part of the decision process, not only the final illustration of it.

EXAMPLES

Current examples. A wider field of use.

The current examples still reflect QCALVIEW's origins in landscape and project visualisation. The underlying mechanism is deliberately generic: a viewpoint, geographic data, terrain, a projection and an optional photograph.

Journalism Archaeology Urban planning Heritage Environment Infrastructure Geomatics Research Public communication Renewable energy

WHO IS IT FOR?

For anyone who needs to see geographic data from somewhere.

The common denominator is not an industry, but a question: what does this mapped information look like from this viewpoint?

Renewable energy is where QCALVIEW was forged - not where it stops.

Renewable energy & visual impact

Check wind, solar and agrivoltaic projects from calibrated viewpoints.

Use terrain, visibility, GIS overlays and optional photography to support visual-impact assessment, early photomontage workflows, panorama checks, screening-hedge studies and project comparisons directly from QGIS.

Journalism & investigations

Turn mapped facts into a viewpoint readers can understand.

Put sites, boundaries, infrastructure or planned changes into perspective while keeping their geographic position traceable to the source map.

Archaeology & heritage

Relate mapped evidence to the landscape in which it is interpreted.

Project remains, monuments, routes, terrain or hypotheses into a present-day photograph, historical image or schematic field view.

Urban & territorial planning

Read plans from the street, the neighbourhood or the wider territory.

Test footprints, alignments, volumes and redevelopment scenarios before moving to heavier modelling or presentation workflows.

Environment & landscape

Move from spatial analysis to an observer-based reading.

Combine terrain, vegetation, visibility, mitigation measures and mapped projects to understand how spatial relationships translate into a view.

Infrastructure & engineering

Put routes and structures into context before detailed visual production.

Project mapped alignments, structures or construction hypotheses from selected viewpoints for early checks, coordination and explanation.

Fieldwork & geomatics

Connect survey, map and photograph without breaking the workflow.

Use calibrated viewpoints, projected layers and monoplotting-oriented tools to support field interpretation and map ↔ view control.

Research & education

Make spatial hypotheses easier to see, discuss and challenge.

Turn coordinates and geometries into an observer-based representation for teaching, research and exploratory analysis.

Public communication

Make a geographic choice understandable while it can still change.

Create grounded views for meetings, consultation and decision-making, and keep them live enough to test alternatives during the discussion.
?

If the map tells you where , QCALVIEW helps you ask from where and how it appears .

That question exists in far more fields than visual-impact studies.

WHY QCALVIEW EXISTS

A different way to think about GIS visualisation.

Perspective should be a way of interrogating geographic data - not automatically a separate production pipeline.

After years working between GIS, photography and visual simulation, I kept encountering the same gap: the map is excellent at describing where things are, but the moment the question becomes “what does this look like from here?” , the workflow often jumps to another application, another data model, or another specialist.

There was also a false choice I wanted to remove: either accept a quick representation that is merely “close enough”, or move immediately into a heavier specialist workflow. I wanted the same tool to support both exploration and control - start fast, then tighten the geometry when the question demands it.

QCALVIEW viewer showing geographic data in perspective
THE VIEW AS A GIS QUESTION geography · observer · perspective
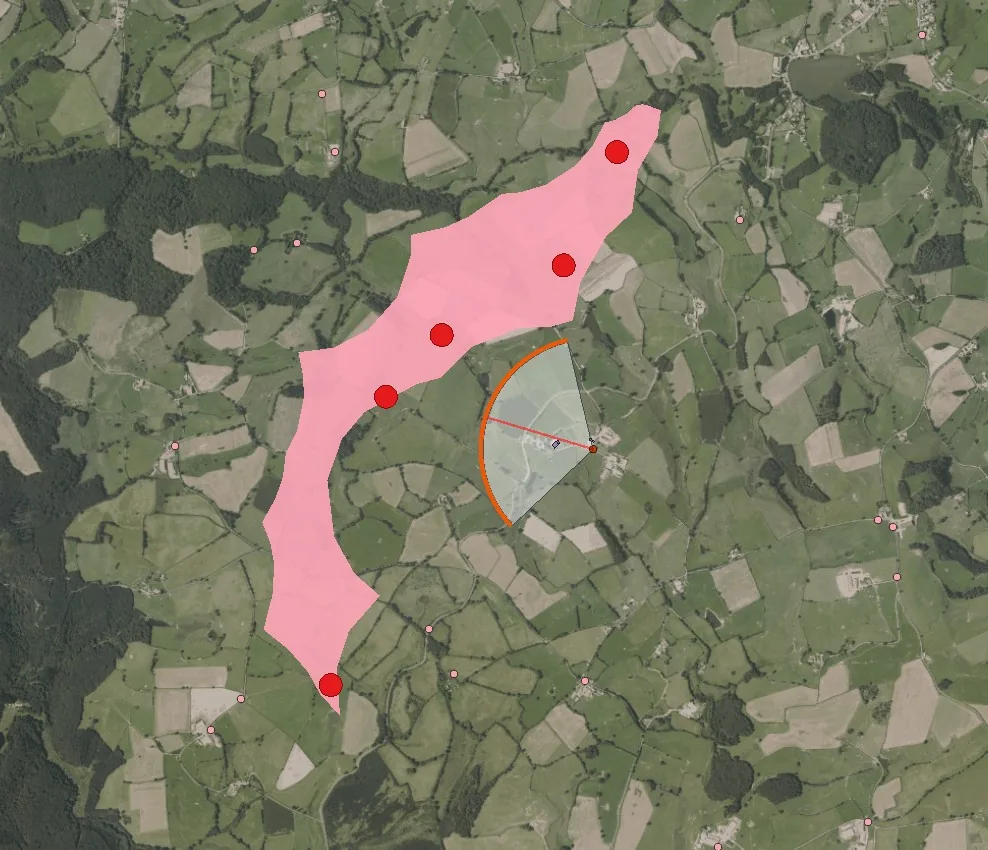
QGIS project with a viewpoint and mapped field of view
KEEP THE SOURCE VISIBLE QGIS remains the spatial source of truth

I did not set out to build another 3D viewer. I wanted to make perspective a native way of reading geographic data : keep the data in QGIS, define the observer explicitly, project what matters, use photography when it helps, stay schematic when it does not, and escalate to specialist software only when the deliverable genuinely requires it.

That also changes when visualisation can happen. It does not have to arrive at the end as a finished image. In a meeting, the QGIS project can stay open, the hypothesis can be edited, and the perspective can become part of the conversation itself.

QCALVIEW is the result of turning that idea into a working, open-source tool - so the method can be used, tested and extended well beyond the field in which it was first developed.

Fabrice Kerzerho Creator of QCALVIEW · ArcTan°

QUICK ANSWERS

QCALVIEW, in practical terms.

Direct answers to the questions people usually ask before installing or testing the plugin.

What is QCALVIEW?

QCALVIEW is an open-source QGIS plugin that projects geographic data into an observer-based perspective. It can work as a schematic GIS view or use a calibrated photograph as the visual background.

Is QCALVIEW a photomontage tool?

QCALVIEW supports photo-overlay and visual-simulation workflows by placing mapped geometry, terrain and project elements into calibrated images. It can prepare and accelerate photomontage work, while specialist 3D or image-production software remains appropriate when a final deliverable requires it.

Can it be used for wind, solar and agrivoltaic projects?

Yes. QCALVIEW was initially developed around renewable-energy and landscape workflows: wind turbines, photovoltaic and agrivoltaic layouts, visual-impact assessment, panoramic viewpoints, screening measures and visibility checks.

Does QCALVIEW work without a photograph?

Yes. Photography is optional. A viewpoint, terrain and GIS data are enough to build a schematic perspective; a photograph can then be added when correspondence with the real view matters.

Does QCALVIEW require a terrain model?

Yes for rendering. A DEM, DTM or DSM raster must be explicitly selected in QCALVIEW. Merely having a raster loaded in the QGIS project is not sufficient.

Where do I install QCALVIEW?

QCALVIEW ALPHA-40.20.4 is distributed through the official QGIS Plugin Repository as an experimental plugin for QGIS 3.44 and QGIS 4.x.

DOCUMENTATION

Learn the workflow. Then make it your own.

The documentation covers calibration, terrain, projected layers, projection models, the viewer, export and practical workflows. Tutorials will expand as the public alpha matures.

LATEST RELEASE

QCALVIEW ALPHA-40.20.4

Available now from the official QGIS Plugin Repository. QCALVIEW remains deliberately Experimental / Alpha and is currently aimed first at experienced QGIS users who are comfortable checking project data, coordinate reference systems and projection parameters, and reporting reproducible issues.

AVAILABLE FOR TESTING Plugin version 40.20.4 Experimental / Alpha QGIS 3.44 + QGIS 4.x Free & open-source · GNU GPL v3+

TEST FROM QGIS

No ZIP download is required for normal installation.

  1. 01

    Open Plugins > Manage and Install Plugins...

  2. 02

    In Settings, enable Show also experimental plugins if experimental plugins are hidden.

  3. 03

    Open All and search for QCALVIEW.

  4. 04

    Select QCALVIEW and click Install Plugin.

ALPHA-40.20.4 AT A GLANCE

  • Calibrated viewpointsPosition, orientation, field of view and photographic calibration.
  • Projected GIS layersPut vector geometries, symbols, patterns and schematic objects into the observer's view.
  • Terrain and occlusionUse elevation, relief, horizon and depth to control what is visible.
  • Rectilinear and panoramic workflowsWork with pinhole / rectilinear, cylindrical and equirectangular projections.
  • Live work inside QGISEdit mapped hypotheses, refresh the perspective and use the view during reviews and meetings.

BEFORE TESTING

Terrain and coordinate systems matter.

A terrain raster is required for rendering. Before generating a preview or export, explicitly select a DEM / DTM / DSM in QCALVIEW's terrain settings; merely loading a raster in the QGIS project is not sufficient. Use a suitable projected metric CRS for the working area and verify that viewpoints, vector layers and terrain are correctly referenced.

Make bug reports reproducible.

When reporting a problem, include the QGIS and QCALVIEW versions, operating system, project CRS, relevant layer and terrain CRS, projection mode, and a short description or screenshot showing the expected and observed result.

EXPERIMENTAL MEANS EXPERIMENTAL

The pinhole / rectilinear workflow is currently the most mature. Panoramic behaviour, complex SVG rendering, live refresh and performance on heavy scenes are still being refined. Production outputs should be visually checked by the operator.

Read the current limitations ↗

ROADMAP

Build a perspective layer for QGIS, step by step.

The current architecture remains a QGIS/Python prototype. Priority goes to reliability and useful workflows before any heavy native or GPU rewrite.

NOW

Stabilise the core

  • Pinhole / rectilinear rendering
  • Occlusion and Z consistency
  • Viewer / live refresh
  • Large-scene performance

ACTIVE

Make panoramas dependable

  • Cylindrical / equirectangular consistency
  • Depth and ±180° edges
  • Sizes, positions and exports
  • Panoramic performance

NEXT

Extend the visual language

  • Projected and draped rasters
  • Hybrid high-quality SVG rendering
  • Batch exports and visibility checks
  • More faithful reuse of QGIS styles

Roadmap items are indicative and can evolve with testing, contributions and real-world use.

SUPPORT QCALVIEW

Fund development time, not a feature purchase.

QCALVIEW is developed independently. Contributions support maintenance, testing, QGIS compatibility, documentation and roadmap work. They do not buy priority for a particular feature.

01

Use it and test it

Run QCALVIEW on representative projects, document reproducible issues and help expose edge cases.

Send testing feedback ↗
02

Contribute

Code, documentation, test datasets, translations and workflow feedback can all help the project mature.

Project repository ↗